| name | value |
|---|---|
| region | Region of the world |
| country | Country |
| year | Year |
| name | Name of populist party or candidate |
| vote_share | Vote percent received by the party or candidate (%) |
| turnout | Percent of eligible and/or registered voters who participated in the election by casting a vote. |
| won_seat | Coded as 1 if the party or candidate won a seat in the election. Coded as 0 otherwise. |
| pressystem | Coded as 1 if the system is a presidential one and 0 otherwise |
| preselection | Coded as 1 if this is a presidential election and 0 otherwise |
| migrantshare | Percent of migrants in total population |
| gini | World Bank estimate of the Gini Index (0-100) |
| growth | World Bank estimate of average GDP growth per year |
Corruption and populism
Instructions
- For the data, right-click, “save/download file as…”
- Open the data
- Complete all of the tasks associated with that data and keep track of your answers / images
- Once you are done, go on Canvas and answer the questions related to the assignment
- the Canvas assignment is timed; if you open it prior to completing the tasks you will run out of time
My awkward Google Sheets video tutorials are here
Skills used:
- Sorting/filtering
- Counting categories
- Constructing new variables
Corruption in Latin America
Find a story about corruption in a Latin American country of your choosing. Describe what the corruption entails: what exactly is taking place that people consider corrupt? If you don’t understand, or the story does not have enough detail, find another story. Include a link to the story. (~200 words, 3 points).
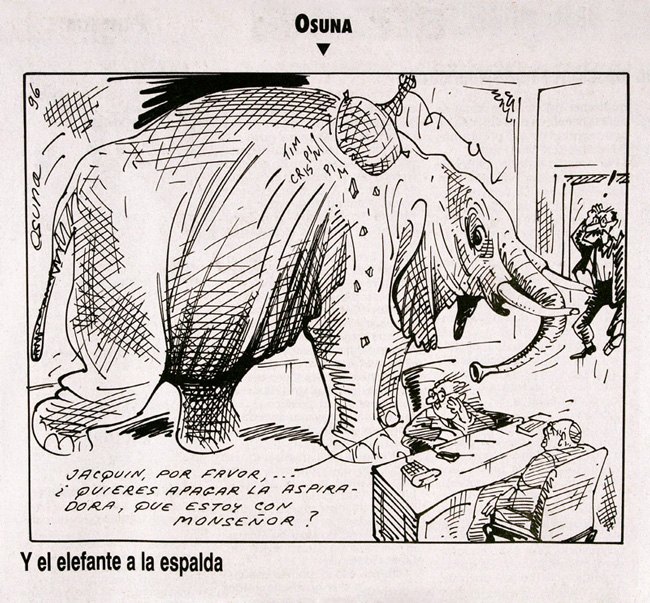
Look at the political cartoon below, from 1996, depicting Colombian presidential candidate Ernesto Samper. Do some digging around online, and discuss the meaning of each cartoon (3-4 sentences per cartoon). What are the cartoons making fun of? Why an elephant? (3 points).

Populism
Let’s look at data from Stanford’s Votes for Populists Database. Each row in the database records the electoral performance and other characteristics of populist parties across Europe, Latin America, and Asia. Note: I have cleaned and renamed some of the variables from the original dataset.
How do the creators of this database decide if a party is populist or not? Look up the codebook and describe how they determine if a party is populist. (2 points).
Which country has the most instances of populists participating in elections in Latin America? You’ll want to count how many times each country appears as a row in the dataset. (1 point)
- Multiplying a party’s vote share (%) by the turnout level (%) gives you the party’s percent of the total eligible electorate (i.e., the percent of all eligible voters who voted for that party). Create a new variable called eligible that takes this form: \(\text{Eligible}_{\%} = \frac{(\text{Vote Share}) \times (\text{Turnout})}{100}\). What was the largest PERCENT of the eligible electorate won by any party in any region? (1 point).
- Come up with a thoughtful question someone could answer with this data. Describe your question, what you did with the data to answer it, and what the answer is. Roughly 100 words. (3 points)