| original | labels |
|---|---|
| pais | Country |
| q2 | Age |
| etid | Ethnicity |
| ed | Years of Schooling |
| colorr | Skin tone (as observed by enumerator) |
| q10new_14 | Monthly Household Income |
| d5 | Approval of Homosexuals’ Right to Run for Office (1 - strong disapprove, 10 - strong approve) |
| d6 | Approval of Same-Sex Couples’ Right to Marry (1 - strong disapprove, 10 - strong approve) |
Race, identity, and poverty
Instructions
- For the data, right-click, “save/download file as…”
- Open the data
- Complete all of the tasks associated with that data and keep track of your answers / images
- Once you are done, go on Canvas and answer the questions related to the assignment
- the Canvas assignment is timed; if you open it prior to completing the tasks you will run out of time
Skills used:
- counting categories
- plotting
- sorting/filtering
- summary statistics / grouped summary statistics
Task 1: Identity in LA
Task 2: Race and skin-tone
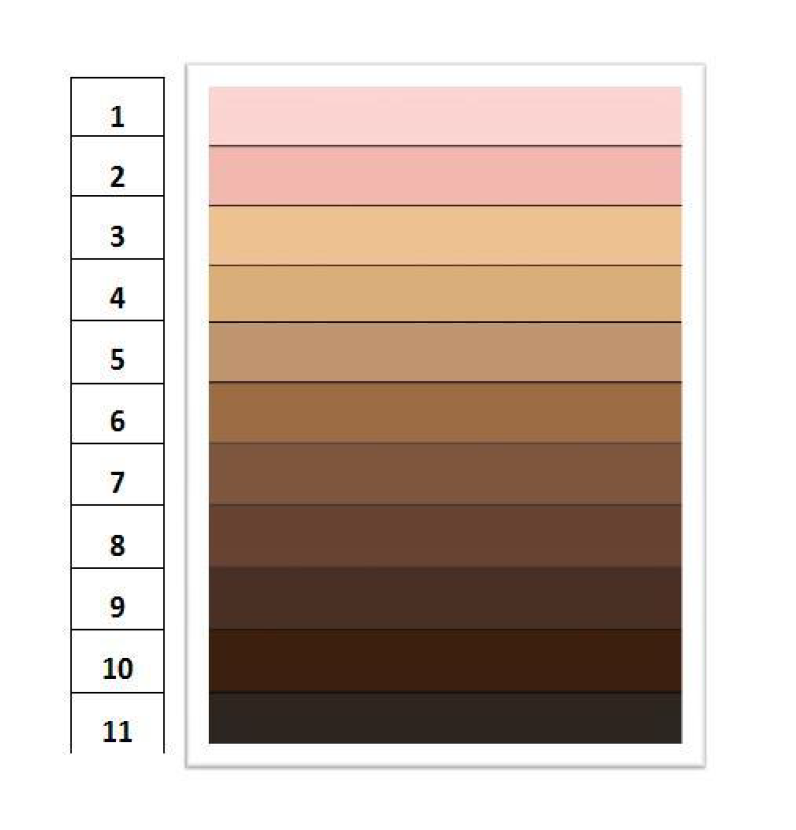
Here, we are going to work with a big survey of 4 countries fielded in 2014 by the Latin American Public Opinion Project. Download the dataset here. Each row in the dataset is a person who answered the survey. For the skin tone variable see the palette at the bottom of this page.
- Let’s look at ethnic identity in the region. Count the number of people who identify with each ethnic category. What PERCENT of respondents identify as Mestizo? (1 point)
- Let’s look at ethnic identity across countries. Count the number of people who identify with each ethnic category, by country. Hint: this will involve putting two variables on
row. HOW MANY people identify asindigenousin the country with the most indigenous respondents? (1 pt)
Look at the color palette below from the Latin American Public Opinion Project. Pick a skin tone. Count the number of people who identify with each ethnic group, but filter so you are only looking at people with your skin tone. Now, make a bar chart of
etidto look at the distribution of ethnic categories for people with this particular skin-tone. Save the barplot to upload to Canvas. (1pt)Discuss the plot in light of the Telles and Paschel reading. ~200 words. (1pt).
Variable dictionary
Task 3: Measuring Wealth
Let’s look at data on household assets from Honduras in 2018. Each of the r columns tells you whether or not a household has a particular asset (e.g., fridge, cell phone, etc.). If a household has the asset, the variable = 1, otherwise = 0.
Note that this is called a “dummy” variable; if you take the mean of a dummy variable you get a proportion (e.g., who’s had coffee today? answers = 1, 1, 0, 0, 1 –> 3 / 5 –> 0.6 –> 60% of people have had coffee).
- Calculate the percent of the population that owns each asset. Which asset is the most commonly owned? (1 pt)
- About how much more likely is a household in an urban area to have an indoor bathroom than a household in a rural area? Report the difference in percentage points (e.g., 40% - 35% = 5%). (1 pt)
- If you could only pick one asset to measure whether someone lived in poverty (or not), which would it be? Briefly make the case for that asset. Then, count the number of people who do and do not own that asset. What percent of the population does not have this asset? What are some limitations for the use of this asset as a marker of poverty/non-poverty? ~300 words. (3 points)
Variable dictionary
| original | labels |
|---|---|
| pais | Country |
| ed | Years of Schooling |
| q10new_18 | Monthly Household Income |
| r1 | Television in Home |
| r3 | Refrigerator in Home |
| r4 | Landline in Home |
| r4a | Cellular Telephone in Home |
| r5 | Number of Vehicles at the House |
| r6 | Washing Machine in Home |
| r7 | Microwave Oven in Home |
| r8 | Owns Motorcycle |
| r12 | Drinking water in Home |
| r14 | Indoor Bathroom in Home |
| r15 | Computer in Home |
| r16 | Flat Panel TV in Home |
| r18 | Internet Service in Home |
| ur | Urban/Rural |
| q14 | Intends to Live or Work Abroad |
| fs2 | Has Run Out of Food in the Last 3 Months (1 = yes) |
| fs8 | Has Gone without Meals in the Last 3 Months (1 = yes) |
| wf1 | Receives Government Assistance (1 = yes) |
Color palette